Here’s the thing: for years, the conversation around American languages has felt a bit like staring at the same two towering skyscrapers, English and Spanish, while ignoring the vibrant, sprawling cityscape that surrounds them. We’ve grown accustomed to their dominance, and frankly, it’s made us a little… blinkered.
But a fresh look at the latest U.S. Census Bureau American Community Survey data (2020–2024) throws that familiar view into a dazzling kaleidoscope. Suddenly, we’re not just seeing two giants; we’re witnessing a complex, dynamic mix of human connection, woven from threads of immigration, Indigenous heritage, and deep regional histories. It’s a revelation that redefines what “America’s languages” truly means.
What was everyone expecting? Probably more of the same, a predictable pattern. But this data? It’s a splash of cold water, a vibrant jolt, showing us that the linguistic heart of America beats with far more than just its two most prominent pulses.
Chinese Dominates Coastal and Tech-Hub States
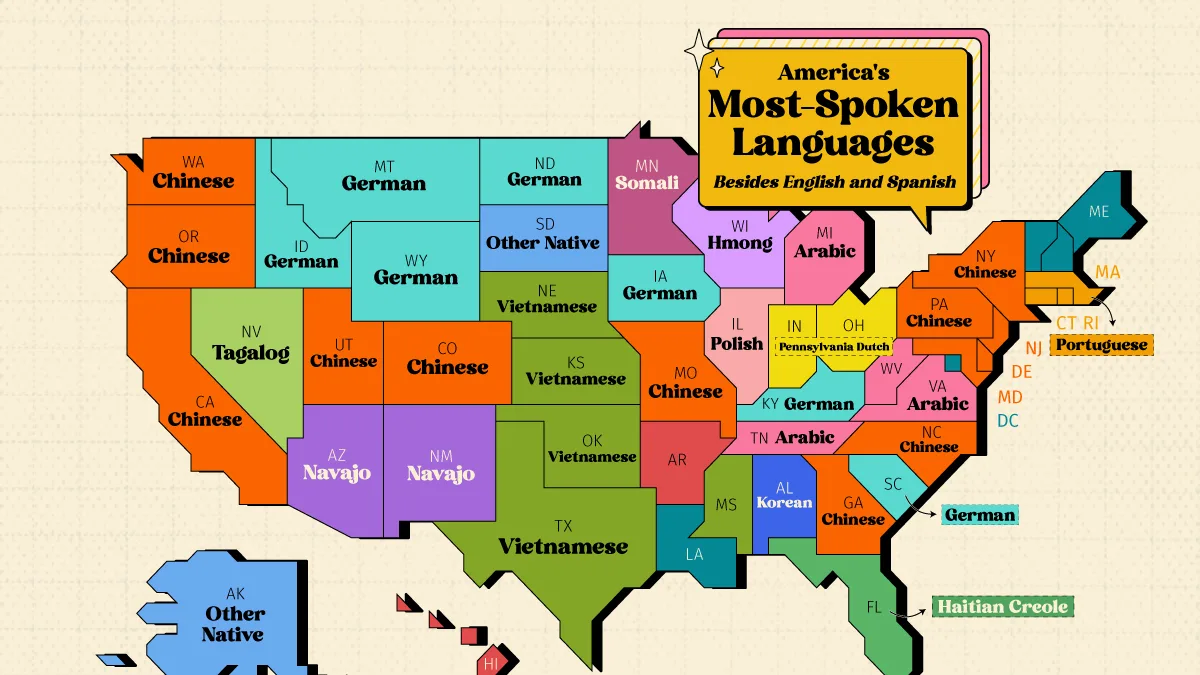
This is the big headline: Chinese. Not just spoken, but dominant as the top non-English, non-Spanish language in a staggering 13 states. Think California, New York, Georgia – the engines of our economy, the hubs of innovation. It’s a powerful proof to the enduring draw of both established Chinatowns and the gleaming new metropolises attracting skilled workers from across the globe. It tells a story of recent immigration, yes, but also of generations-old communities that have been building and contributing to these states for over 150 years.
This concentration in coastal states and booming Sun Belt economies isn’t accidental. It points directly to the magnetic pull of technology and business sectors that thrive on a globally connected workforce. California alone, with over 1.2 million Chinese speakers, and New York, with more than 600,000, are not just states; they’re linguistic microcosms reflecting a globalized present.
German’s Historic Footprint Remains Visible
And then there’s German. It’s a name that echoes from a different era, yet it still holds sway in parts of the Plains and Mountain West. States like Montana, Wyoming, Idaho, Iowa, and North Dakota still count German as their most spoken language after English and Spanish. This is not a relic; it’s a living echo of the massive German immigration waves of the late 1800s. German was once the largest non-English language in America. While World War I certainly cast a long shadow, leading to a sharp decline, and immigration restrictions later tightened the grip, the linguistic roots run deep. It’s a fascinating, almost stubborn persistence.
Regional Language Clusters Reflect Migration Patterns
The map isn’t just a collection of isolated dots; it’s a story of corridors. French, for instance, snakes along the border with Quebec and finds a unique home in Louisiana, a nod to historical ties and ongoing cultural connections. You see Vietnamese languages flourishing across the South and Plains, and Portuguese strongholds in the Northeast. These aren’t random occurrences; they are direct lines drawn by the pathways of human migration.
Perhaps one of the most poignant reminders of the land’s original inhabitants is the enduring presence of Navajo in Arizona and New Mexico. It’s a powerful symbol of Indigenous resilience and continuity. Similarly, Alaska and South Dakota stand out for their significant populations speaking Indigenous North American languages. This isn’t just data; it’s a deep cultural resonance that predates any immigration.
My unique insight here? The real story isn’t just which languages are spoken, but where and why. This data acts like a geological survey of American settlement and identity. The ‘second most spoken’ language in each state isn’t just a linguistic footnote; it’s a historical artifact, a social marker, and a vibrant indicator of the forces—both ancient and modern—that have shaped who we are as a nation.
It’s a powerful counter-narrative to the often simplified, sometimes fearful, discourse around immigration and cultural change. This isn’t about replacement; it’s about enrichment, about the beautiful, messy, and undeniably human process of building a nation out of a thousand different voices.
Why Does This Matter for Developers?
For those of us building the digital future, understanding this linguistic mosaic is more than just an academic exercise. It’s a practical imperative. Localization isn’t just a feature; it’s a fundamental building block of accessible and inclusive technology. Think about the millions of users who interact with software, websites, and apps daily in languages other than English or Spanish. Building tools that cater to this diversity isn’t just good business; it’s essential for true global reach and impact. This data highlights fertile ground for innovation in natural language processing, translation tools, and culturally sensitive UI/UX design. Ignoring these linguistic pockets is like building a bridge and forgetting to connect it to half the town.
Key Takeaways
- Chinese emerges as the dominant non-English, non-Spanish language in 13 states, particularly in coastal and tech-heavy regions.
- German’s historical influence is still evident, remaining the most spoken language after English and Spanish in several Plains and Mountain West states.
- The data reveals distinct regional language clusters, reflecting diverse immigration patterns and the enduring presence of Indigenous languages.
Learn More on the Voronoi App
If you enjoyed today’s post, check out The World’s Most Spoken Languages by Total Speakers on Voronoi, the new app from Visual Capitalist. Use This Visualization
🧬 Related Insights
- Read more: Selenium vs Playwright in 2026: Time to Scrap the Old Dog?
- Read more: Python Teaching Assistant v1.0.3: Refactor That Pays Off
Frequently Asked Questions
What does “most-spoken language” mean in this context? It refers to the language individuals report speaking most often at home, excluding English and Spanish.
Will this data influence technology development? Absolutely. Understanding linguistic distribution is key for localization, AI training data, and building inclusive digital products that reach wider audiences.
How does this compare to historical language data? While German’s historical dominance has waned, the map shows the persistence of legacy languages and the rise of newer immigrant languages, indicating a dynamic and evolving linguistic landscape.