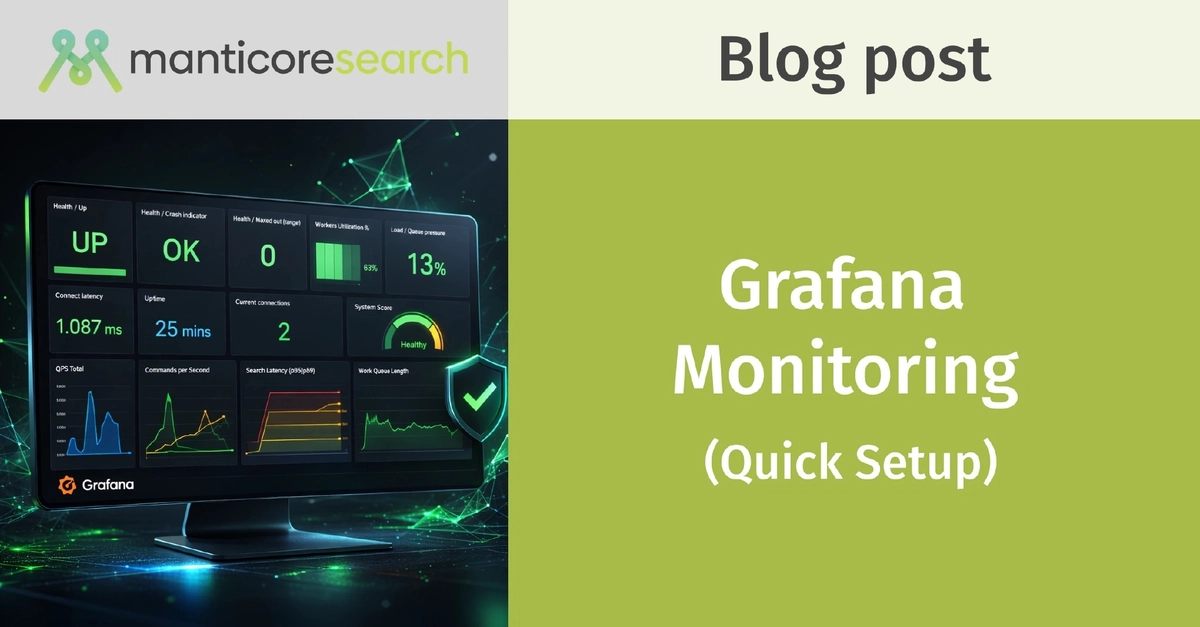
One Docker Command: Manticore Search Monitoring That Actually Works
Database slowdowns without crashes are the worst. Manticore's new Grafana dashboard fixes that with a single Docker run, surfacing hidden issues fast.
⚡ Key Takeaways
Worth sharing?
Get the best Developer Tools stories of the week in your inbox — no noise, no spam.
Originally reported by dev.to
Related Stories

AI Dev Tools
Manticore Search's Prepared Statements: Bulletproofing Your Queries Against the Hackers of Tomorrow

Cloud & Infrastructure
Ditching Cloudflare for Bunny.net: One Dev's Wake-Up Call
DevOps & Platform Eng
Free Website Monitoring's Crushing Hidden Costs
Databases & Backend