The jarring ping of a production alert cuts through the quiet hum of the office, or more likely, the silence of a remote engineer’s home.
For too long, the immediate follow-up has been a tedious data-gathering exercise. Developers tasked with diagnosing a production incident typically face a steep climb: reconstructing the context of the problem. This often involves lengthy exchanges, digging through dashboards, and piecing together a mental map of services, their dependencies, and the specific metrics or logs that might hold the key. The fundamental friction point has been that AI assistants, despite their conversational prowess, operate in a vacuum, forcing users to re-educate them with every new query.
Grafana Assistant, however, is pushing a different paradigm with its new “infrastructure memory” capability. Forget starting from scratch. This isn’t about the AI learning on demand; it’s about the AI learning ahead of time. Think of it as equipping a detective with a detailed dossier on the crime scene before the first witness is even interviewed. By continuously studying your infrastructure, Assistant builds a persistent knowledge base, ensuring that by the time you pose your first question, it already possesses a foundational understanding of what’s running, how it’s interconnected, and where to direct its analytical gaze.
This proactive learning means Assistant automatically grasps the nuances of your environment: the services you run, their complex connections, the critical metrics and labels that define performance, the location of relevant logs, and your deployment topology. It’s akin to handing the AI a pre-annotated map of your entire digital landscape before it embarks on its problem-solving mission.
Why This Matters for Real-World Troubleshooting
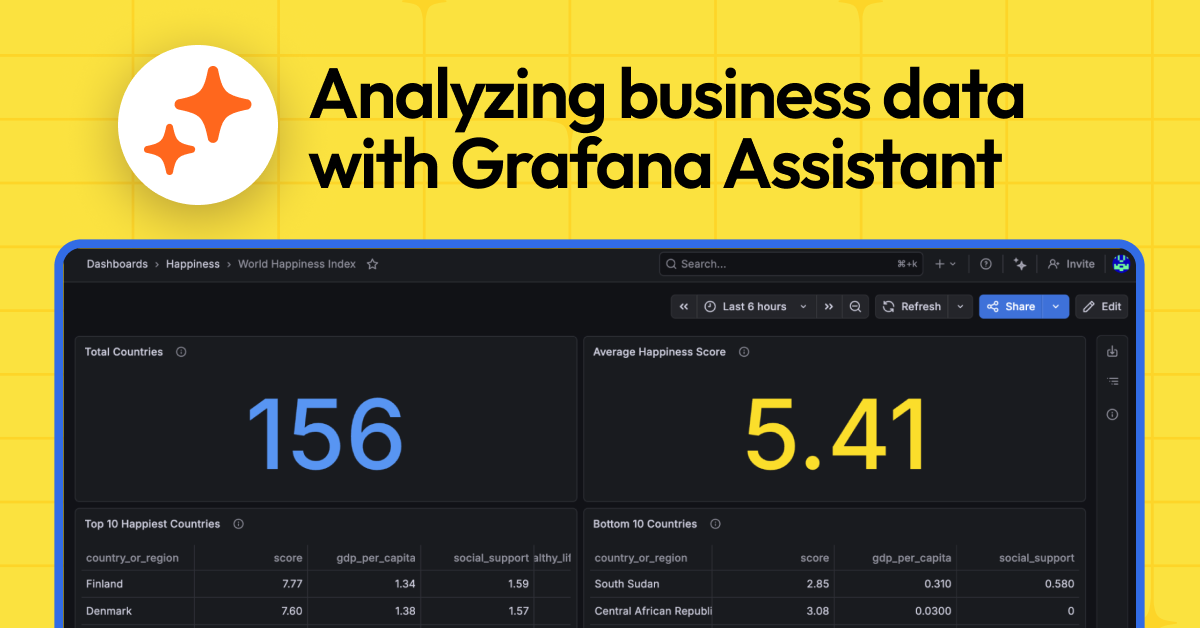
The payoff? Conversations that are not just faster, but demonstrably more accurate. When you inquire about a specific service, Assistant bypasses the typical data source discovery dance. It already knows, for instance, that your payment system communicates with three distinct downstream services, where its latency metrics are housed within a specific Prometheus instance, and that its logs are formatted as structured JSON within Loki. This pre-loaded context can shave precious minutes off response times during critical incidents—minutes that can significantly mitigate business impact.
Furthermore, this functionality offers a profound advantage for teams lacking ubiquitous expertise. A developer troubleshooting an issue within their own service can now confidently query upstream dependencies, receiving precise answers even for systems they’ve never directly managed. This democratizes operational insight.
The Unseen Engine: How It Works
Assistant’s infrastructure memory operates in the background, operating with remarkable zero-configuration elegance. A distributed network of AI agents performs the heavy lifting:
Data source discovery: The system meticulously identifies all connected Prometheus, Loki, and Tempo data sources within your Grafana Cloud stack.
Metrics scans: Agents engage in parallel queries across your Prometheus data sources to pinpoint services, deployments, and critical infrastructure components.
Enrichments via logs and traces: Data from Loki and Tempo sources is intelligently correlated with their corresponding metrics. This process enriches the context with details about log formats, trace structures, and identified service dependencies.
Structured knowledge generation: For each identified service group, agents produce comprehensive documentation. This documentation covers five key areas: the service’s identity and purpose, its essential metrics and labels, its deployment configuration, its upstream and downstream dependencies, and the structure of its logs.
This meticulously gathered information is then stored as searchable, semantic chunks within a vector database. This architecture enables information retrieval in mere milliseconds, whether by you or by the assistant itself, facilitating lightning-fast semantic searches.
The system’s understanding is kept current through an automated weekly refresh cycle, ensuring your assistant’s knowledge base evolves in lockstep with your dynamic environment.
For every service group discovered, Assistant captures a rich five-category knowledge profile:
- Identity and purpose: This includes what the service is, its primary function, its associated namespace and cluster, and the technology stack it employs.
- Key metrics: The actual metric names and relevant labels directly from your Prometheus data sources—not generic placeholders—including essential golden signals like latency, error rate, traffic, and saturation.
- Deployment topology: Details on Kubernetes resources, replica counts, scaling configurations, and specific container attributes.
- Dependencies: A clear mapping of upstream and downstream service connections, database and cache relationships, message queue interactions, and any external integrations.
- Log structure: Analysis of available log labels and their values, identification of common log formats (JSON, logfmt, or unstructured), recognition of prevalent patterns, and extraction of key field names.
This level of granular, environment-specific context is precisely what differentiates a generic AI response from a truly actionable one.
And here’s the kicker: this isn’t a feature you need to toggle on, configure, or meticulously maintain. It runs automatically for all Grafana Cloud customers utilizing Assistant. No setup, no configuration files, no scheduled jobs to babysit. Your existing telemetry data—the metrics, logs, and traces already flowing into your Prometheus, Loki, and Tempo data sources—serves as the raw input. The assistant simply builds its sophisticated understanding from what’s already there. If you’re feeding metrics into your system, you’re already provisioned for this enhanced infrastructure memory.
The New Competitive Landscape for Observability AI
This development represents a significant market shift. Previously, the AI observability tool landscape was characterized by a reactive approach. Companies like Chronosphere, Honeycomb, and Datadog have all been pushing AI capabilities, but the foundational requirement for detailed pre-configuration or on-the-fly context ingestion remained. Grafana’s move to an automated, persistent knowledge base fundamentally alters the competitive dynamic. It’s akin to a car manufacturer shifting from offering optional GPS to embedding satellite navigation as standard. This lowers the barrier to entry for sophisticated AI-driven insights and forces competitors to re-evaluate their own context-gathering strategies. The underlying vector database technology is becoming table stakes, but the proprietary intelligence in how Grafana Assistant populates and maintains that database is where the real innovation lies. It moves the needle from “AI can help” to