Alright, let’s talk Prometheus. For the old guard, the expectation was always a bit of a wrestle. Installing it yourself, wrestling with config files, praying your firewall rules don’t accidentally expose your monitoring system to the entire internet. It was… a process. And then, just when you thought you had it locked down, a new Ubuntu version drops, and suddenly your carefully crafted setup is a historical artifact. This guide, however, promises a slightly less painful path, slinging Prometheus onto Ubuntu 24.04 via Docker Compose, complete with automatic HTTPS handled by Traefik.
Who is this actually for? Well, if you’re the type who looks at apt install prometheus and breaks out in a cold sweat, this is probably your jam. It’s for the folks who want a working Prometheus server, over HTTPS, with minimal fuss and a reasonable expectation that it won’t immediately break with the next OS update. The core promise? A functional Prometheus instance serving metrics securely.
Taming the Prometheus Beast with Docker
Look, I’m not going to pretend the original way of doing things was bad. Prometheus is a solid piece of open-source infrastructure, and its PromQL is genuinely powerful for digging into your systems. But let’s be honest, the barrier to entry has always been a bit… thorny. This Docker Compose approach aims to smooth out a lot of those edges. No more hunting down the right version of this library or that dependency. It all lives inside containers.
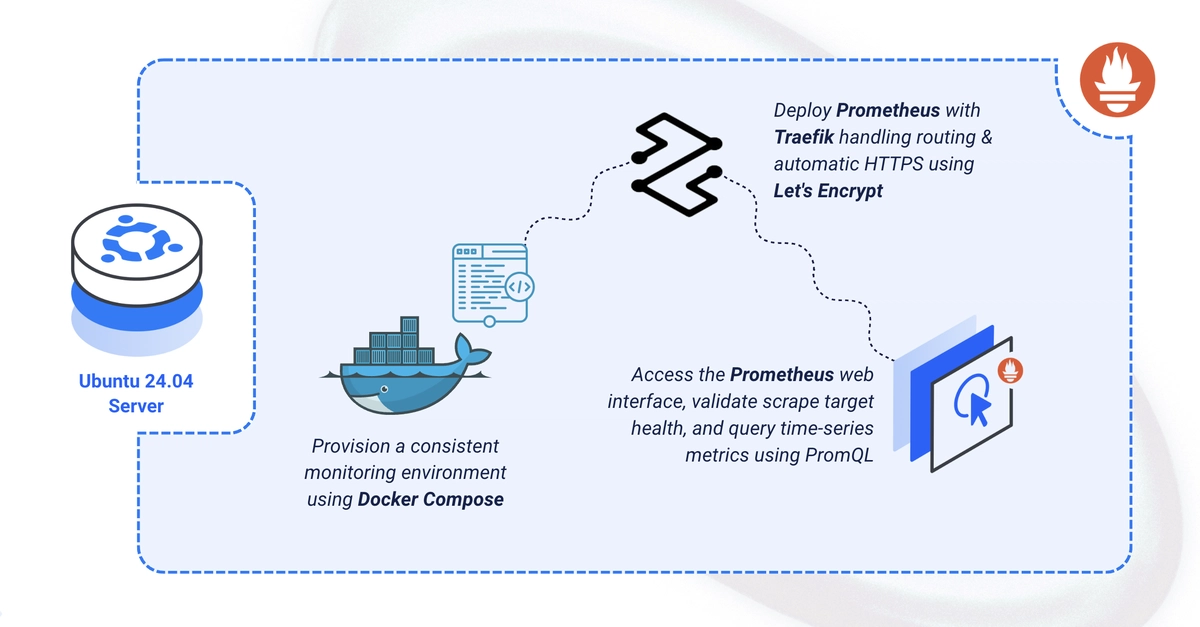
The setup is pretty straightforward, almost suspiciously so. You spin up a directory structure, toss in a basic prometheus.yml config, create a .env file for your domain and email (because Let’s Encrypt needs a valid address, naturally), and then you hit it with a docker compose up -d. Suddenly, you’ve got Prometheus, happily chugging away.
The Magic of Traefik and HTTPS
This is where things get interesting for the security-conscious (or just the plain lazy who don’t want to muck with manual SSL certs). Traefik, acting as your reverse proxy, is configured to automatically handle SSL certificate acquisition and renewal via Let’s Encrypt. This means your Prometheus instance isn’t just accessible; it’s accessible securely, over HTTPS, using your specified domain. It’s the kind of thing that used to involve a whole separate setup process, now it’s just a few lines in a <a href="/tag/docker-compose/">docker-compose</a>.yaml file.
By the end, you’ll have Prometheus collecting and serving metrics over HTTPS at your domain.
This quote, folks, is the crux of it. It’s not about inventing a new way to monitor. It’s about making an established, reliable tool easier to deploy and secure. And in the chaotic world of cloud-native deployments and ever-changing infrastructure, that’s a win.
Is This the Future? Or Just a Band-Aid?
Here’s my take: while this Docker Compose method is undeniably slick for getting Prometheus up and running quickly, it’s crucial to remember what it’s not doing. It’s not fundamentally changing Prometheus itself. It’s a deployment strategy. For true enterprise-level, highly available, clustered Prometheus deployments, you’ll still be looking at more complex solutions like Thanos or Cortex. This is more akin to getting your personal server humming or a small team’s monitoring sorted out without a huge investment in infrastructure knowledge.
And who’s making money here? Well, the Vultr folks are likely happy you’re using their platform to host this. Docker and Traefik themselves are open source, but their commercial offerings and the general ecosystem around containerization certainly benefit. Ultimately, the real money is being made by companies that need reliable insights into their systems. Prometheus is a tool to get that, and if this makes it more accessible, that’s a win for them, and indirectly, for the companies employing them. It’s the classic open-source enabling commercial success model.
So, should you ditch your current Prometheus setup for this? Probably not if you’re already running a strong, scaled deployment. But for new projects, or for those who’ve shied away from Prometheus due to setup complexity, this guide offers a compelling, significantly less painful entry point. It’s a good example of how containerization continues to simplify complex software deployments.
What Can You Do Next?
Once you’ve got Prometheus happily serving metrics over HTTPS, the real work begins. The guide points to adding more scrape targets – your applications, those pesky node exporters that tell you about your servers, and anything else spewing metrics. Then comes the grand vizier of monitoring dashboards: Grafana. Connecting Prometheus as a data source there unlocks the true visual power, allowing you to build dashboards that make sense of all that data. And for the truly paranoid (or prepared), configuring alerting rules and routing them through Alertmanager is the final frontier.
This entire process, from directory creation to querying up, feels like a well-worn path made smoother. It’s less about groundbreaking innovation and more about pragmatic engineering – making good tools accessible. And in the often-overhyped world of tech, that’s something to actually write home about.
🧬 Related Insights
- Read more: ESP32-C5 Arrives: Wi-Fi 6 for Your Smart Home
- Read more: Docker’s Spaceship Magic: My Bootcamp Ride from Panic to ‘It Just Works’
Frequently Asked Questions
What does this guide do to Prometheus?
This guide shows you how to deploy Prometheus using Docker Compose on Ubuntu 24.04, configuring it to serve metrics securely over HTTPS using Traefik for automatic certificate management.
Will this setup handle massive scale for enterprise environments?
While this Docker Compose setup is excellent for getting started, it’s primarily for smaller-scale deployments. For large-scale, highly available enterprise environments, solutions like Thanos or Cortex are typically required.
Is Traefik a necessary component for this Prometheus setup?
Traefik is used here to provide automatic HTTPS. You could technically set up Prometheus with Docker Compose without Traefik, but you would need to manually configure TLS termination or expose Prometheus over HTTP, which is generally not recommended for production environments.