The operational overhead for deploying and managing critical infrastructure tools can often overshadow their utility. For years, setting up a Grafana instance — the go-to for visualizing metrics, logs, and traces — meant navigating certificate renewals, reverse proxy configurations, and often, a fair bit of manual tinkering. The expectation was always a strong, secure deployment, but the path there could be thorny.
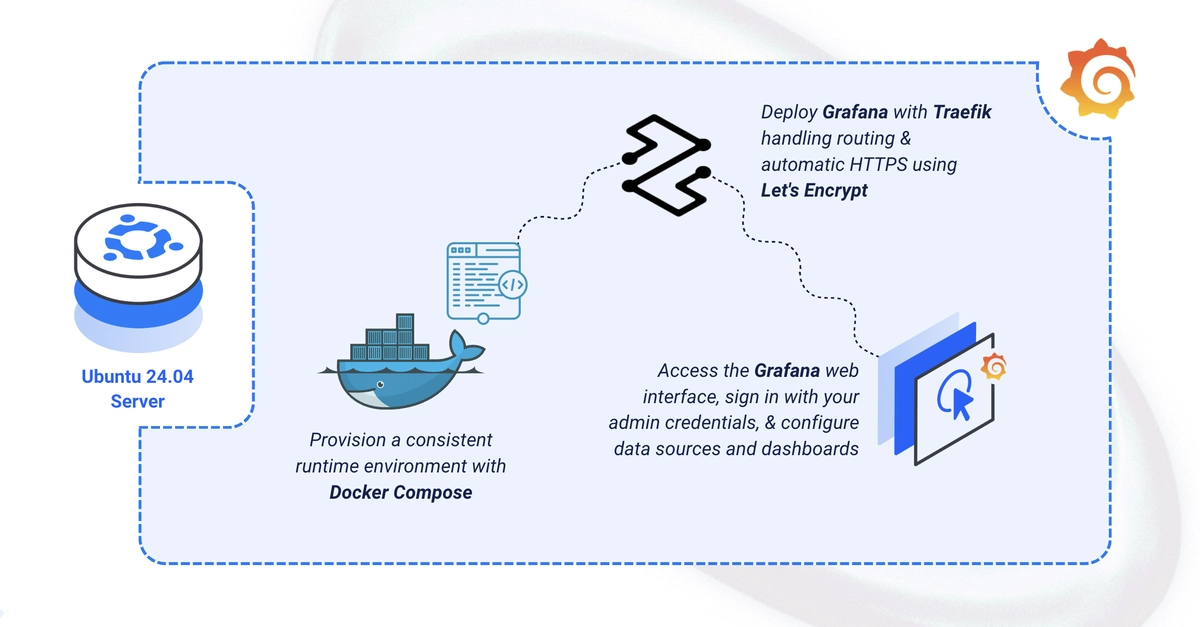
This new approach, however, flips the script. By leveraging Docker Compose and the ever-reliable Traefik reverse proxy, the process transforms from a potential headache into a remarkably straightforward affair. We’re not just talking about getting Grafana up and running; we’re talking about it being immediately accessible via HTTPS, with certificates managed automatically. This isn’t just convenience; it’s a significant reduction in the attack surface and ongoing maintenance burden, a win for any DevOps team.
Why This Docker Compose Approach Matters
What everyone expected was a functional Grafana installation. What this guide delivers is more: a production-ready setup out-of-the-box. The reliance on Docker Compose means portability and repeatability, critical for modern CI/CD pipelines. Traefik, with its dynamic configuration and Let’s Encrypt integration, abstracts away the complexities of SSL certificate management. This isn’t merely a tutorial; it’s a blueprint for efficiency.
Consider the alternative: manually installing Grafana on an Ubuntu server, configuring Nginx or Apache as a reverse proxy, obtaining and renewing SSL certificates through Let’s Encrypt or another provider, and then ensuring those configurations are applied consistently across environments. It’s a multi-step process, rife with potential for human error, and frankly, a time sink that could be better spent analyzing the data Grafana is meant to visualize.
The key takeaway here is the shift towards declarative infrastructure. Instead of a series of imperative commands, we’re defining the desired state of our Grafana deployment in a <a href="/tag/docker-compose/">docker-compose</a>.yaml file. This is the language of modern infrastructure management, and it’s heartening to see it applied so effectively to a tool as ubiquitous as Grafana.
Traefik handling automatic HTTPS… By the end, you’ll have Grafana running with a persistent data store and a secured admin login at your domain.
This single sentence from the original guide encapsulates the core value proposition. It’s not just about deployment; it’s about secure and automated deployment. The DOMAIN and LETSENCRYPT_EMAIL variables in the .env file, combined with Traefik’s configuration, automate the entire TLS handshake. No more forgetting to renew a certificate and facing an outage.
Is This the Future of Observability Tooling Deployment?
It’s hard to argue against this model. The market has been signaling a clear preference for containerized, self-managing infrastructure components. Tools that integrate smoothly with container orchestrators and automate their own security posture are the ones that gain traction. Grafana, by embracing this approach, solidifies its position not just as a visualization tool, but as a component within a well-architected, resilient observability stack.
My critique? While this guide is excellent for a single-instance deployment, the next logical step for scale would involve Kubernetes. However, for many small to medium-sized operations, or for development and staging environments, this Docker Compose setup is precisely what’s needed. It democratizes the deployment of a powerful observability platform, making it accessible without requiring deep Kubernetes expertise.
This deployment pattern is more than just a technical shortcut. It represents a strategic alignment with industry best practices, prioritizing security and reducing operational friction. It’s about making powerful tools accessible, not by simplifying their core function, but by simplifying their integration into the broader IT ecosystem. And in today’s complex operational environments, that’s a significant advantage.
The instructions themselves are concise and logical. Create directories, set permissions, define environment variables for security and domain configuration, and then orchestrate the services via Docker Compose. The subsequent commands to bring the services online (docker compose up -d) and verify their status (docker compose ps, docker compose logs) are standard, effective diagnostics. Accessing Grafana via https://grafana.example.com is the clean, secure endpoint everyone hopes for.
This is the kind of pragmatic, developer-first approach that builds trust. It acknowledges the realities of operational burdens and offers a pragmatic, efficient solution. Expect to see more tooling follow similar patterns.