The fluorescent hum of servers in a dimly lit data center is a distant memory for most, replaced by the glow of a laptop screen and the endless churn of cloud provider dashboards. And that’s where Grafana Cloud is stepping in, or perhaps, re-stepping in, with a new feature that lets you customize its prebuilt views for AWS, Azure, and Google Cloud.
Look, we’ve all been there. You’re staring at another one of those generic dashboards, the kind that promises the moon but delivers a cloudy, vague overview. Grafana Cloud, in its latest move, is offering a way out of that purgatory. They’re rolling out Cloud Provider Observability customization, which sounds fancy, but essentially means you can stop staring at the default screens and start seeing what actually matters to your team.
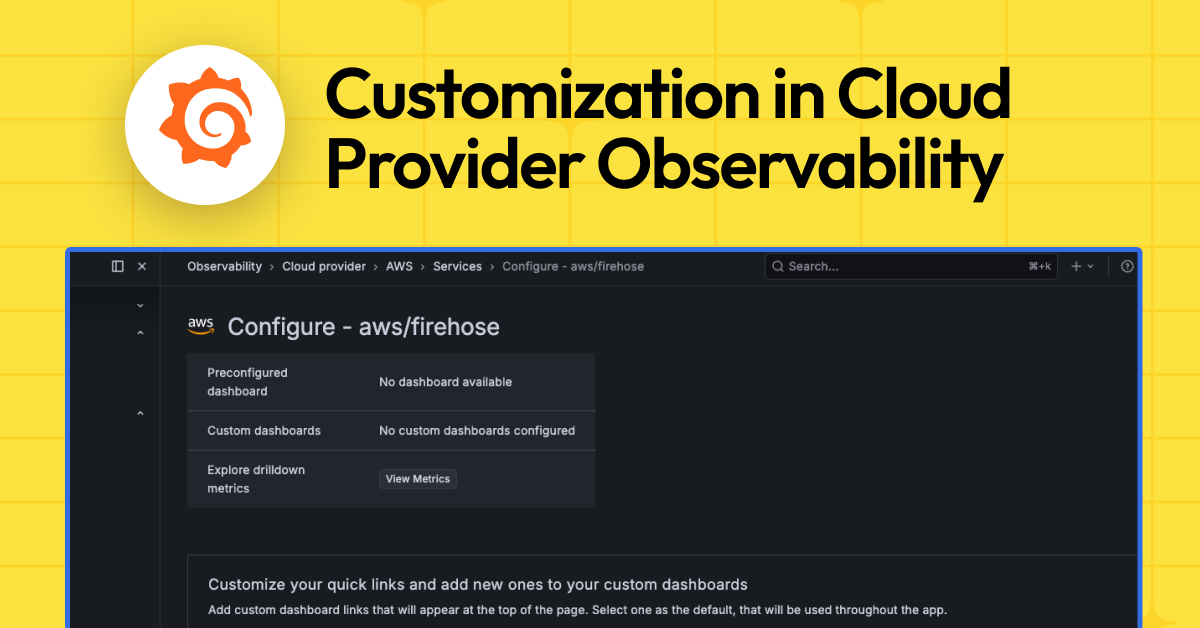
So, what’s the big deal? For starters, they’re giving you prebuilt dashboards. Great. Except, as the PR puts it, “you might already have dashboards you trust, want a view tailored to your team’s workflow, or need to change which panels show up when you drill into a single instance.” Bingo. This is the core of it. Nobody wants a one-size-fits-all solution in the sprawling chaos of cloud infrastructure.
Why Bother Customizing Default Dashboards?
This isn’t just about slapping a new logo on an existing screen. Grafana’s making a play for deeper integration into your existing workflows. They’re pushing three main capabilities: quick links and default dashboard selection, instance drill-down customization, and AI-generated dashboards. It’s a familiar tune – offer flexibility, cater to the power user, and sprinkle in some AI magic to keep things shiny.
Basically, whatever you set as the default dashboard is what pops up when you access a service from the main services tab or the entity graph. Think of it as giving your cloud services a personalized welcome mat. Your own custom dashboards get added as extra quick links, which is a nice touch for easy access. It’s about making the interface bend to your will, not the other way around. And who is actually making money here? Well, the more sticky Grafana Cloud becomes, the more people are likely to pay for it, especially teams drowning in cloud complexity.
Instance Drill-Down: Seeing the Details
The real meat, in my book, is the instance-level drill-down. You know, when you click into a single RDS instance or a specific VM and get that detailed view? Grafana’s letting you curate that. You can swap out panels, add custom queries, reorder everything, and generally make that deep dive exactly what you need it to be. This is where the rubber meets the road for debugging and performance tuning. No more sifting through irrelevant metrics when you’re trying to nail down a production issue.
The panels and queries you configure under “Customize the panels…” are exactly what render in the instance-level view everywhere that view is used.
This is the kind of granular control that, frankly, should have been standard years ago. It’s not just about seeing your cloud infrastructure; it’s about seeing it in a way that immediately tells you what’s going on. The fact that these customizations apply across Cloud Provider Observability, Database Observability, and the entity graph means you’re not just configuring it once for one corner of the system; it’s a consistent experience.
The AI Wildcard
And then there’s the AI. “Generate with AI.” It’s the buzzword du jour, isn’t it? Grafana claims it can whip up a ready-to-use dashboard with the right variables and panels (think RED or USE methodologies) with a click. If it works as advertised, it’s a neat shortcut for teams that don’t have the time or expertise to build these things from scratch. But we’ve seen AI tools in this space before, and the results can be… variable. Is it going to spit out genius insights or just a lot of pretty, but ultimately useless, charts?
It’s a welcome addition for those who want to experiment or quickly set up a basic monitoring view. However, I’d bet actual dollars that the true power users, the ones who really care about this customization, will still be meticulously hand-crafting their dashboards. They’ll use the AI as a starting point, perhaps, but the fine-tuning will be human-driven. It’s the same story with code generation – helpful, but rarely a replacement for deep understanding.
Who Benefits Most?
This is clearly aimed at users who are already invested in Grafana Cloud and are managing significant cloud footprints. If you’re running AWS, Azure, and GCP, you’re likely juggling a lot of moving parts. The ability to bring some order to that chaos, to make the monitoring tools reflect your specific operational needs, is a genuine value proposition. It’s for the platform engineers, the DevOps teams, the folks who live and breathe infrastructure and are tired of wading through the noise.
Ultimately, Grafana’s playing the long game here. By offering deeper customization, they’re making their platform more indispensable. It’s a smart move to lock in users and differentiate from competitors who might offer more static, less adaptable monitoring solutions. The question will be how well the AI performs in practice and how easy it is to truly make these dashboards sing.
🧬 Related Insights
- Read more: Variable Fonts: CSS Magic or Just Hype?
- Read more: Vector Graph RAG: Multi-Hop Reasoning Powered Purely by Vectors
Frequently Asked Questions
What does Cloud Provider Observability in Grafana Cloud do? It provides preconfigured dashboards and drill-downs for monitoring AWS, Azure, and Google Cloud resources, with new features allowing deep customization of these views.
Can I use my own existing dashboards with Grafana Cloud? Yes, you can connect your existing dashboards to Grafana Cloud and set them as the default view for specific cloud services.
Will this AI feature replace my job as a dashboard designer? While AI can generate dashboards, human oversight and expertise are still crucial for tailoring them to specific, complex needs and ensuring accurate, actionable insights.